Stocks featured in this article are: NRG Energy Inc. (NRG), Open Text Corp. (OTEX), PartnerRe Ltd. (PRE), Sanofi-Aventis (SNY) and Triumph Group (TGI).
Lately, I've been running screens to try and assess a company's real value.
The Price-to-Earnings ratio, or P/E, is probably the most common ratio in determining whether a company is under or overvalued.
However, the Price-to-Cash Flow, or P/CF, is another great ratio to do just that.
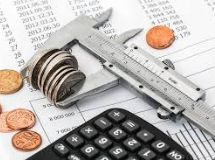
Cash, of course, is vital to a company's financial health, especially nowadays. It is needed to finance operations, invest in the business, etc.
And cash can't really be manipulated on the Income Statement like earnings can.
The reason why some like the P/CF measurement better than the P/E ratio is because the net income of the Cash Flow portion rightly adds back depreciation and amortization, since these are not cash expenditures.
Whereas the net income that goes into the Earnings portion of the P/E ratio does not add these in, thus artificially reducing the income and skewing the P/E ratio.
So many analysts prefer using the Price to Cash Flow metric to judge a stock's value.
And just like the P/E ratio is calculated by dividing the Price by its Earnings per share -- the Price to Cash Flow ratio is calculated by dividing the Price by its Cash Flow per share.
Also like a P/E ratio, the lower the number, the better.
Currently, the average Price to Cash Flow (P/CF) for the stocks in the S&P 500 is roughly 9. For the P/E ratio it's 12.
But like the P/E ratio, a value of less than 20 is considered good.
However, make sure you compare the stock's P/CF to its Industry, as different Industries will have different numbers that are considered normal.
Screen
The screen I'm running today is relatively simple.
* Zacks Rank <= 2
(Only Buys and Strong Buys get thru.)
* One Year Projected Growth Rate >= Average for the S&P 500
(Looking for above market growth rates.)
* Current Cash Flow >= 5 Year Average Cash Flow
(I want to see the Company's cash position improving.)
* Price to Cash Flow <= Median for its Industry
(Want to see Companies with valuations lower than the median for their respective groups.)
The screen came up with some interesting names. Here are 5 from this week's list:
NRG NRG Energy Inc.
OTEX Open Text Corp.
PRE PartnerRe Ltd.
SNY Sanofi-Aventis
TGI Triumph Group
Lately, I've been running screens to try and assess a company's real value.
The Price-to-Earnings ratio, or P/E, is probably the most common ratio in determining whether a company is under or overvalued.
However, the Price-to-Cash Flow, or P/CF, is another great ratio to do just that.
Cash, of course, is vital to a company's financial health, especially nowadays. It is needed to finance operations, invest in the business, etc.
And cash can't really be manipulated on the Income Statement like earnings can.
The reason why some like the P/CF measurement better than the P/E ratio is because the net income of the Cash Flow portion rightly adds back depreciation and amortization, since these are not cash expenditures.
Whereas the net income that goes into the Earnings portion of the P/E ratio does not add these in, thus artificially reducing the income and skewing the P/E ratio.
So many analysts prefer using the Price to Cash Flow metric to judge a stock's value.
And just like the P/E ratio is calculated by dividing the Price by its Earnings per share -- the Price to Cash Flow ratio is calculated by dividing the Price by its Cash Flow per share.
Also like a P/E ratio, the lower the number, the better.
Currently, the average Price to Cash Flow (P/CF) for the stocks in the S&P 500 is roughly 9. For the P/E ratio it's 12.
But like the P/E ratio, a value of less than 20 is considered good.
However, make sure you compare the stock's P/CF to its Industry, as different Industries will have different numbers that are considered normal.
Screen
The screen I'm running today is relatively simple.
* Zacks Rank <= 2
(Only Buys and Strong Buys get thru.)
* One Year Projected Growth Rate >= Average for the S&P 500
(Looking for above market growth rates.)
* Current Cash Flow >= 5 Year Average Cash Flow
(I want to see the Company's cash position improving.)
* Price to Cash Flow <= Median for its Industry
(Want to see Companies with valuations lower than the median for their respective groups.)
The screen came up with some interesting names. Here are 5 from this week's list:
NRG NRG Energy Inc.
OTEX Open Text Corp.
PRE PartnerRe Ltd.
SNY Sanofi-Aventis
TGI Triumph Group
SHARE


