Commodity futures pertain to the buying or selling of a commodity at a fixed amount at a predetermined date. It shields buyers against the risks of price fluctuations of a raw material or product. On the other hand, this arrangement benefits sellers, as they can sell their products at a locked-in price.
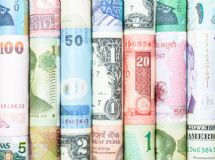
Commodity futures trading can be very risky for inexperienced investors. This is due to the high amounts involved in this type of trading. For instance, an investor can purchase a thousand barrels of oil pegged at $50,000. Due to the large amount involved, a small change in the price of oil can yield either a large gain or loss when compared to the initial margin.
Buying commodities is often motivated by two instances. The first is when buyers anticipate that the price of a commodity will increase in the future. The second reason is when a producer, such as a farmer, needs to sell his products in the future and he wants to sell the goods at a set price.
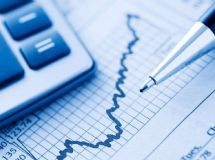
Engaging in commodity future trading is highly complicated. Some investors study futures prices over a specific period of time; however, the past prices of commodities will not always indicate if a commodity's price will go up or down during a certain amount of time. This is where commodity charts can come in and help investors make more informed investing decisions.
Barchart features a comprehensive list of commodity charts that can assist investors in predicting the movement of prices of commodities for a certain period. Barchart is a leading provider of real time and delayed information on stocks with resources like technical analyses, indicators and charts.
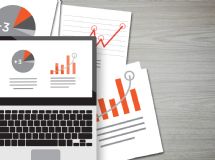
Barchart has every commodity traded in the financial markets, from currencies and metals to grains. Details like high and low prices, contracts and changes in prices are indicated in each commodity. Users simply have to click on the commodity to access more information, such as commodity price quote, trend strength and the commodity's individual 20-day average. There is also a Barchart technical opinion, which indicates if the commodity is a strong or weak sell. Likewise, Barchart offers news and technical analyses on commodities, helping investors better understand how a certain commodity should perform in the future.
Commodity future trading is a very complex area for investors. After all, no one can predict the future. However, with the help of Barchart, investors can have a better chance of making wise selling and buying decisions on commodities. For more information, visit http://www.barchart.com.
Commodity futures trading can be very risky for inexperienced investors. This is due to the high amounts involved in this type of trading. For instance, an investor can purchase a thousand barrels of oil pegged at $50,000. Due to the large amount involved, a small change in the price of oil can yield either a large gain or loss when compared to the initial margin.
Buying commodities is often motivated by two instances. The first is when buyers anticipate that the price of a commodity will increase in the future. The second reason is when a producer, such as a farmer, needs to sell his products in the future and he wants to sell the goods at a set price.
Engaging in commodity future trading is highly complicated. Some investors study futures prices over a specific period of time; however, the past prices of commodities will not always indicate if a commodity's price will go up or down during a certain amount of time. This is where commodity charts can come in and help investors make more informed investing decisions.
Barchart features a comprehensive list of commodity charts that can assist investors in predicting the movement of prices of commodities for a certain period. Barchart is a leading provider of real time and delayed information on stocks with resources like technical analyses, indicators and charts.
Barchart has every commodity traded in the financial markets, from currencies and metals to grains. Details like high and low prices, contracts and changes in prices are indicated in each commodity. Users simply have to click on the commodity to access more information, such as commodity price quote, trend strength and the commodity's individual 20-day average. There is also a Barchart technical opinion, which indicates if the commodity is a strong or weak sell. Likewise, Barchart offers news and technical analyses on commodities, helping investors better understand how a certain commodity should perform in the future.
Commodity future trading is a very complex area for investors. After all, no one can predict the future. However, with the help of Barchart, investors can have a better chance of making wise selling and buying decisions on commodities. For more information, visit http://www.barchart.com.
SHARE


